How to Create the Systems Thinking Diagrams
Complex systems can’t be seen as individual parts. We need a broader perspective to see the whole pattern that causes the problem, as many factors as affecting both the current state and the desired state of the system. The systems thinking theory was first introduced by Jay Forrester and members of the Society for Organizational Learning at MIT in his book, The Fifth Discipline, to help us see a complex system as a framework with interrelationships between different internal and external elements that affect the system.
Related articles:
The Six Systems Thinking Steps to Solve Complex Problems
What Does Systems Thinking Teach us About the Problems of Problem-Solving Practice
Design Schools Should Teach Systems Thinking, and This is Why
What is Systems Thinking?
Systems thinking (Also known as system dynamics) is an approach to address problems by looking into them as a whole rather than small parts and considering the dynamic nature of the problem. Each element affects the other elements in the system. The approach helps us to present the root solution by considering the impact of this solution on different parts of the system. Systems thinking extend to seeing the world around ad complex interested systems that influence each other rather than isolated systems. The below video visualises what systems thinking mean:
Think about reducing the price of a specific product to ncrease sales. This will negatively affect the quality of the product and increase external competitiveness. Therefore, the systems thinking diagram provides us with a visual aid to understand the connection between different factors in the system.
Characteristics of the Systems Thinking
Before building the systems diagrams, we first need to understand the general principles that control the complex systems known as The 11 Laws of the Fifth Discipline (Check What Does the Systems Thinking Teach us About the Problems of Problem-Solving Practice). These principles were highlighted in the Fifth Discipline theory by Peter Senge in his book, The Fifth Discipline: The Art and Practice of the Learning Organization. These principles are below:
1- Today’s problems come from yesterday’s solutions. So, before adopting any new solutions, it is very important to understand the history of the existing problem.
2- The harder you push, the harder the system pushes back in a phenomenon known as “compensative feedback.”
3- Behavior grows better before it grows worse
4- The easy way out usually leads back in, therefore, the best solution is to understand the problem from a systematic approach to eliminate it.
5- The cure can be worse than the disease
6- Faster is slower. For example, If the solution aims to increase the system productivity beyond its optimal rate, the system may actually slow down to compensate for this change in growth rate.
7- Cause and effect are not closely related in time and space

8- Small changes can produce big results—but the areas of the highest leverage are often the least obvious
9- You can have your cake and eat it too — but not all at once. The systems thinking method teaches us that we need to look at the big picture. We can provide a complete solution that accomplishes all of the required goals if we consider achieving these solutions based on a determined timeline.
10- Dividing an elephant in half does not produce two small elephants. The problems need to be seen as a whole rather than as individual parts.
11- There is no blame. One of the common difficulties when solving problems is to point the finger at someone as the sole guilty person. However, in system thinking, everyone is part of a whole system
Structure of the Systems Thinking Diagrams
In order to build the systems thinking diagram, we need to clearly identify the elements of the system and how it interacts with each other. Building the systems diagrams requires four steps; identify the events, identify the pattern of behaviour, build the system, and determine the mental models.

Step 1: Event
The first step is to identify the problem at hand that we would like to learn about. This may include one or more related problems to be addressed. For example:
- Customers wait for a long time at the reception
- The unsatisfied patients at the hospital reception in the systems thinking in healthcare setup
Step 2: Patterns of Behaviors
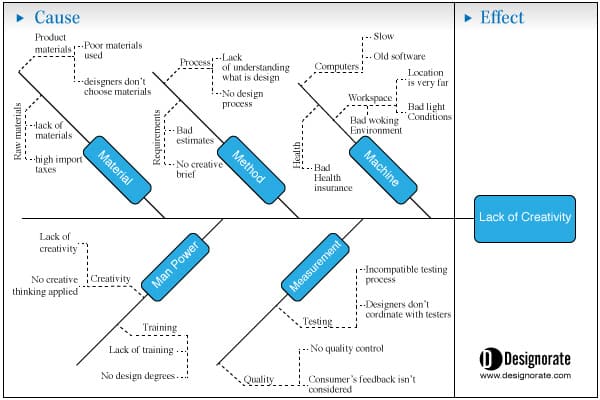
The next step is to observe the patterns that show the relationship between different elements involved in the system. These elements represent the potential causes of the problem (effect). The Cause Effect Diagram can help identify the different causes that may involve the problem highlighted in the previous step.
Charts like the one below can show the positive and negative relation between different factors and how they contribute to the main problem that need to be analyzed in the system.
Step 3: System
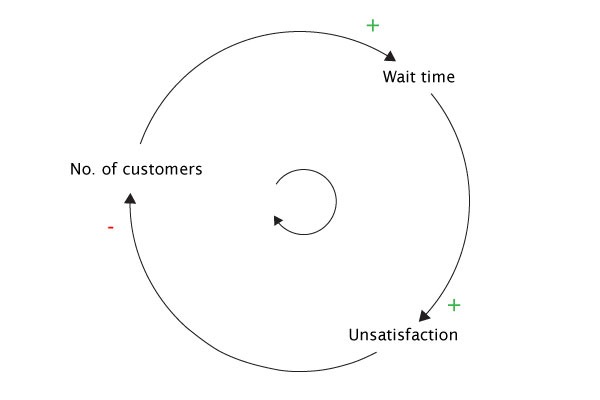
After identifying the potential causes for the final effect. The relation between every two elements in the system is controlled by the feedback loops. The loops either show positive or negative relations, as shown in the figure below. Sometimes, the relationship is referred to as Same/Opposite instead of Positive(+)/Negative(-).

Based on the above relation, there are two types of loops that are classified based on how they change the system:
Balanced feedback loops
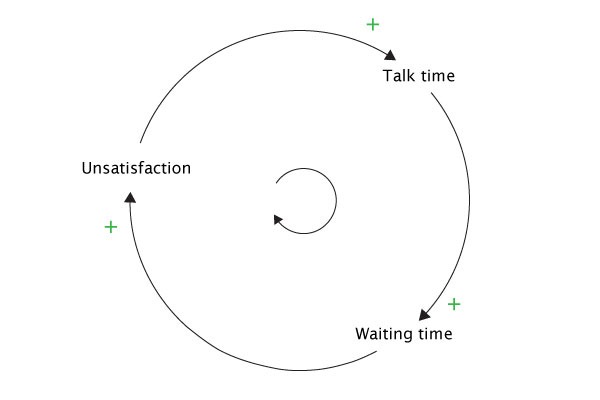
This loop is the natural loop elements that tend to naturalize the impact of the change. For example, talking to each patient in the hospital reception office increases the waiting time, which positively increases the patient’s unsatisfactory. In this example, the feedback “patient unsatisfactory” decreases the impact of the change “talking to the patients.”

Reinforcing Feedback Loops
In contrast to the balanced loop, in the reinforcing loop, the feedback increases the impact of the change. Both are moving in the same positive direction. In our example, reducing the time at the reception office reduces the waiting time and, subsequently, reduces the patient’s unsatisfactory.

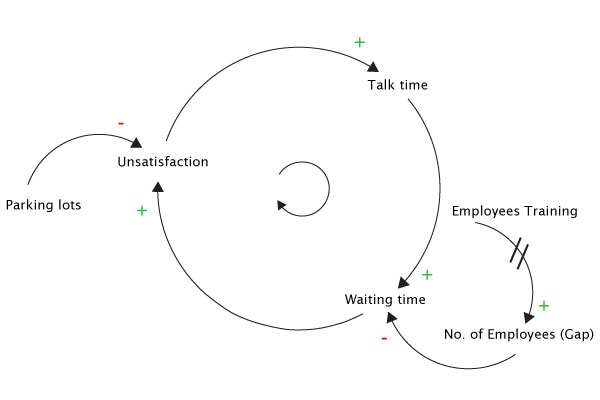
Once we build the relationship between different factors, we can add external factors that affect the system, such as the parking lots available for the patients or the medicine and governmental support…etc.
Identifying Gaps and Delays
In some cases, the current state of one of the elements stands as a barrier to achieving the intended goal or contributing to increasing the problem. These states are known as gaps. For example, the limited number of reception personnel halts any initiative to reach higher patient satisfaction. This factor is set as a gap in the system.

Once the gaps are defined, we can clearly see if our initiative may work out or if we need to fix these gaps before moving further to solving the problems in the system.
As highlighted Fifth Element Theory, the cause and effect may be separated by time and place. Therefore, it is crucial to understand the time delay in the feedback loops. For example, training reception employees to handle patients’ problems more efficiently may take time to see its impact on the system. These delays are represented in the systems by double slashes on the loop.
Further details can be added to the systems diagram, such as adding numerical data that show exactly how each element is affected by the other elements in the system.
Step 4: Mental Models
At the end of the process, the model guides us through the next steps required to achieve the intended goal. For example, improving the customer experience at the hospital front desk may involve the following:
– Increase the parking lots in front of the hospital
– Train the personnel to handle a large number of customers
– Wait for the government to provide better medicine prices…etc.
The below workshop from MIT Open Courses provides another practical example of applying the system dynamics using the Fishbone diagram:
The systems thinking diagrams allow us to effectively apply the theory to understand the different elements in the complex systems by visualizing the relation between them and determining the form of this relation. Once the systems diagram is complete, we’ll better understand of how it works, its gaps, the delays in the system, and how to improve the system based on the concluded data.


