How to Use Task Analysis Grid in Service Design
As a designer, I usually find it challenging to communicate with all the stakeholders in the project, especially in service design, where the product is intangible in contrast to product design. What increases the complexity of this conversation is the nature of how we, as designers, develop our problem-solving mindset while we think visually through mind maps and affinity diagrams. Other stakeholders depend on extended documentation in their decision-making process. This is where the task analysis grid can provide a solid tool for understanding consumer’s complex tasks. In service design, several tools allow us to understand consumers’ experiences during the design thinking process, such as the consumer journey maps and the service blueprint.
What is the Task Analysis Grid?
The task analysis grid is a visual tool that tracks the experience of the consumers when using a specific service. This tracking includes the different touch points with the service, the pain points, and their wishes to improve the service. This experience is then translated into prioritised tasks for the team members. In service design, we need to fully understand consumer behaviour (check the behavioural design guide), experience, and pain to address these challenges in the service design process. When some tools can achieve this, such as the consumer journey maps, it focuses on the consumer experience rather than the associated tasks and how to communicate these tasks with all the stakeholders in the form of prioritised sub-tasks. These issues can be overcome using the task analysis grid, which includes the following elements:
- The definition of the problem includes the consumer persona complaining about the current situation.
- Before, After, and Future scenes are the expected scenarios before fixing the problem, after fixing the problem, and in the future after fixing the problem. Sub-tasks include the steps consumers do before, during, and after using the service.
- Sub-tasks includes the steps that consumer do before, during, and after using the service scenario, including the scenarios associated with each of the steps that consumers face while using the service.
- The scenario includes the scenarios associated with each of the steps consumers face while using the service. Pain points include the pain or the bad experience that causes the consumer to suffer from the service.
- Pain Points include the pain or the bad experience that causes the consumer to suffer from the service. Functionality refers to the functions that need to be fixed or added to improve the service design provided to the consumer. Each function is prioritised to define its importance between all the stakeholders.
- Functionality refers to the functions that need to be fixed or added to improve the service design provided to the consumer. Each function is prioritised to define its importance between all the stakeholders.
Task Analysis Grid vs. the Consumer Journey Map
We can use both the task analysis grid and the consumer journey map to identify the consumer’s experience with one main difference between both. The task analysis grid aims to build an insight into the pain points, define the functionality in the systems, and determine the priority of the tasks to address to eliminate the consumer’s pain points. The consumer journey map aims to identify the consumer’s experience across the different channels regardless of the system functionality involved in each step. Both tools can be used in digital applications such as interface design to map the user’s journey in UX research.
How to Apply the Task Analysis Grid in Service Design
To apply the task analysis grid in service design, we visualise the ideas in the grid based on the above information. In this example, we explore using the task analysis grid to solve a retail service problem. In crowded glossary stores, consumers need help to reach an empty checkout point. So, they get crowded in lines at a specific touch point while the others are less crowded.

We will explore improving this service using the task analysis grid. However, before we start with the steps, we need to define the optimal scene or target that needs to be achieved. To do this, we must depict three scenes: the Before Scene, the After Scene, and the Future Scene. In our example, the three scenes can be described as below:
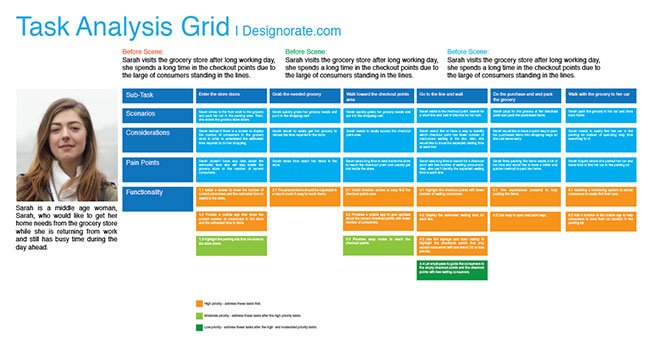
- Before Scene: Sarah visits the grocery store after a long working day. She spends a long time at the checkout points due to the large of consumers standing in lines.
- After Scene: Sarah visits the grocery store after a long working day. She can get her groceries quickly without long waiting times at the checkout points.
- Future Scene: Sarah visits the grocery store after a long working day. She can get her groceries quickly and easily with no more than two persons standing at the checkout points.
After Defining the main scenes, we can continue with the task analysis grid sections below:
Step 1: Define the persona and problem
We will use the persona of a middle-aged woman, Sarah, who would like to get her home needs from the grocery store while she is returning from work and still has a busy time during the day. The grocery store is always crowded, and she takes a long time in the line at the checkout point for payment.
Step 2: Define the sub-tasks
Now, we will define the steps that the consumer do before, during, and after the retail experience:
- Enter the store doors
- Grab the needed grocery
- Walk toward the checkout points area
- Go to the line and wait
- Make the purchase and pack the grocery
- Walk to the grocery to her car
Step 3: The scenarios
The scenarios section includes the experience associated with each of the above sub-tasks. The scenarios clearly describe the situation related to each sub-task. For example, in the first sub-task, Sarah drives from work to the grocery and parks her car in the parking area. Then, she enters the grocery store doors. The same applies to the rest of the sub-tasks, as the figure above highlights.
Step 4: Considerations
At this stage, the consumer thinks of solutions or shares ideas about how they believe this problem can be solved. These considerations are considered in the function section of the task analysis grid. For example, in sub-task number 4, Sarah wants to see a screen that can direct her to the checkout point with fewer consumers standing in line.
Step 5: Define the pain points
The pain points can be detected based on the sub-tasks. In our example, In sub-task 1, Sarah needs to know how busy the store will be to predict the time she will take inside. In Sub-task 3, Sarah needs help identifying which checkout point has the shortest line.
Step 6: Functionality
We need to translate the above data into prioritised functions to share with the design team. In the first sub-task, when Sarah accesses the grocery store doors, a screen can be installed to display the store’s capacity and the current number of consumers already in the store.
The task analysis grid is completed based on the above steps until all the functions are defined and prioritised. Then, it can be assigned to the team members.
Mini Case Study: Applying the Task Analysis Grid in Comcast
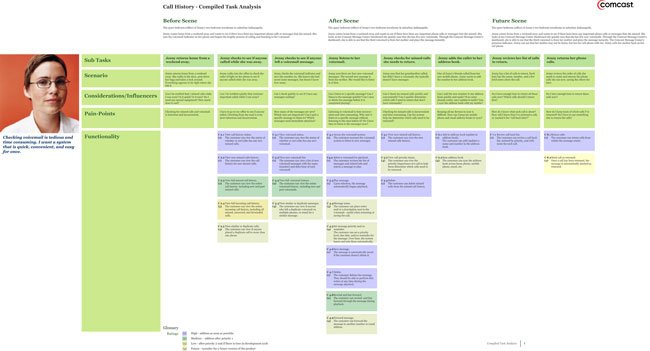
Comcast aims to improve the voice main service for their consumers. In this case study, the persona (Jenny) wants to check her voicemail messages when arriving at her place in suburban Indianapolis. The consumer’s experience is divided into three sections: before the scene, during the scene, and after the scene. Each phase includes a number of sub-tasks presenting the consumer journey while using the service. Then, we define the scenario that is expected in each sub-task and the consideration associated with it.

Then, we define each sub-task’s pain points and associated system functionality. For example, while Jenny checks her voicemail, she would like to get notified if someone important calls her quickly. The functions linked to this sub-task include viewing call history status, new missed calls, viewing full missed calls, and viewing similar or duplicated missed calls in this figure, the priority of tasks distinguished with colours to show which tasks are high in importance and the task that low or could be considered in future products.
The task analysis grid is one of the efficient tools that can address service design challenges by providing a deep understanding of consumer behaviour, their experience, and their pains. While the usage of project requirement can lead to misunderstanding between the design team and stakeholders, the take analysis grid provides a visual of the situation and the tasks that need to be completed and allow the design team to prioritise them based on their contribution to solving the service design problem to achieve an improved consumer experience.


