Exploring Design in the Egyptian Creative Market (Infographic)
There is an agreement between both scholars and practitioners about the important role of design and creativity in the following three fields: education, organization, and government. In a previous article, “Leading Economy Through Design: Applying National Design Policies”, we explored how different countries such as the UK, Germany, Japan, India, and China adopt design policies to strengthen their economies. As highlighted in “10 Top Creative Countries in the World”, many of these countries have obtained a high rank in the prosperity index prepared by the Martin Prosperity Institute.
The research mentioned above highlights various questions; Why are other countries unable to innovate? What are the problems that designers face in these countries? And how can companies and governments help designers to innovate? As part of our investigation into design and innovation in the Middle East and North Africa, we planned a number of primary research-based articles that investigate different design and innovation-related issues and shed light on various questions surrounding this topic, especially in this region of the world that has faced political and economic challenges during the last five years.
Our first survey highlighted here investigates designers’ careers in the Egypt and if designers are underestimated in the Egyptian creative market. This study is based on an online survey that aimed to collect answers from Egyptian designers about the following questions (the format of these questions is shortened from those used in the survey):
- Where is design inside the firm?
- What are the designers’ relations with the company?
- What are the designers’ activities or tasks inside the company?
- How does the company see its priorities?
As there is a lack of research in this domain, this survey represents the results of an initial investigation. Further surveys and investigations will contribute to validating the data collected in this survey.
An infographic has been prepared with the results and can be downloaded from the link provided at the end of the article. The infographic and the information discussed in this article are copyrighted by Designorate and the author, Rafiq Elmansy. For more information about the collected data, sharing, or using any of the mentioned data, please contact us using the Contact Us page.
Information about Respondent Companies
The information about the participants, their companies, and contact information are kept private and will only be used for further communication with them regarding their inputs. Generally, the survey covered the different levels of companies that work in the creative sector in Egyptian cities. The inputs haven been received from cities including Cairo, Alexandria, 10th of Ramadan City, Damanhour, and Zagazig. The respondents come from different creative industries. The majority of them came from advertising agencies (24%), web design and mobile applications (19%), IT and software companies (11%), product design companies (11%), visual arts and crafts companies (8%), social innovation companies (8%), and media and TV companies (5%). Other fields included retail, printing centers, and education fields.
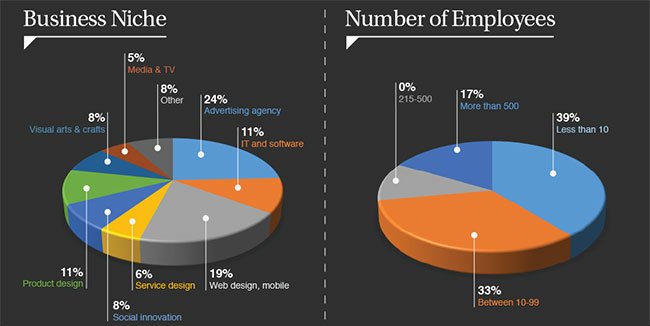
The majority of responses came from small and medium-sized enterprises. Companies with fewer than 10 employees contributed 39% of responses, and companies with 10-99 employees provided 33% of responses. Only 17% of responses came from companies with more than 500 employees. While the demographic information about the companies doesn’t provide direct information about the companies working in the creative field in Egypt, it can provide insight into the different fields working in this sector. Based on the observation, a majority of the companies work in advertising, IT, software, web design, and mobile development fields. Most of the companies fall under the category of micro, small, and medium enterprises.
Information about Respondents
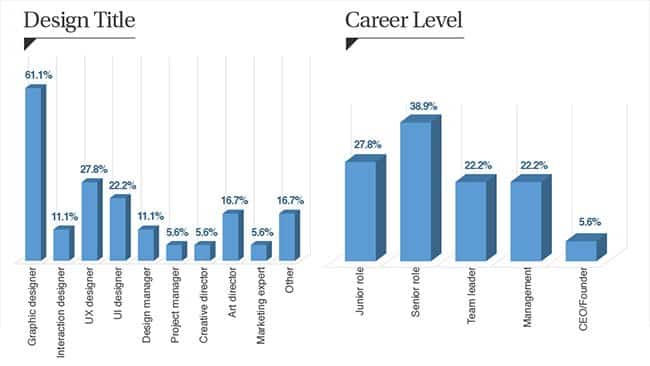
The survey respondents came from varied design careers and positions. Some of the questions were about the respondent. A majority of the respondents are graphic designers (61.1%), user experience (UX) designers (27.8%), user interface (UI) designers (22.2%), art directors (16.7%), project managers (5.6%), creative directors (5.6%), and marketing experts (5.6%). Other responses indicated other job titles including UX consultant, executive manager, and senior motion graphic artist. These responses come from those in senior roles (38.9%), junior roles (27.8%), team leaders (22.2%), managers (22.2%), and CEOs/founders (5.6%). While the graphic designers, UX designers, and UI designers contributed with the largest percentage in the design roles, various levels of careers were represented in the career level section.
Where is Design Inside the Firm?
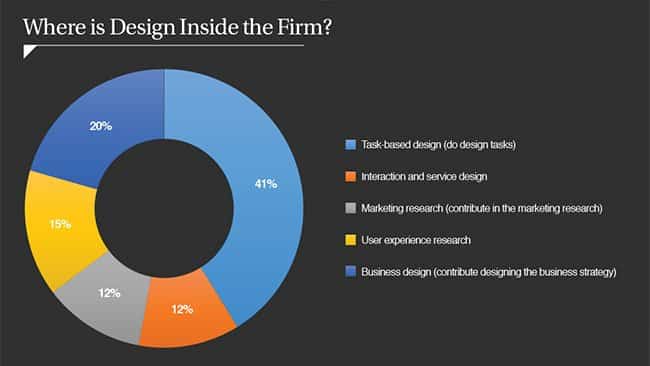
The survey was designed to help understand how design contributes in companies. While design can improve the organization ecosystem on multiple levels, the Egyptian creative sector still sees design as task-based. 41% of the responses indicated that design is limited to tasks such as graphic design or designing products or services. 20% of the responses indicated that design contributes to the business strategy, which is a promising percentage in this area of the world. The other responses were distributed between UX research (15%), integration and service design (12%), and marketing research (12%).
Having design contribute to both creative tasks and business strategy is a promising indicator because design can be used to support other activities such as the design process, or product development process. Expanding the role of design inside a company can contribute to innovation, which has a positive correlation with both profitability and competitiveness.
The Designers’ Relations with the Company?
The following question identified the relations between designers and the companies they work for in terms of eight factors: financial satisfaction, health care, social security, working hours, applying flexible hours in work, emotional factors such as encouragement and rewards, understanding the designers’ roles and participating in the decision-making process.
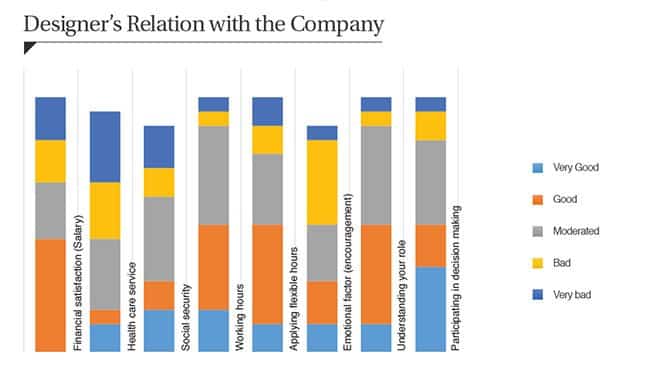
A majority of the respondents were satisfied with their financial position; 44.44% said that their salary is good. The health care received varied responses, with most responding that they had a very bad service (29.41%) or moderate service (29.41%). Social security was most commonly evaluated as moderate (37.50%). The working hours factor was also most commonly found to be moderate (38.89%). Better results were collected about flexible hours; 38.89% indicated it is in a good shape.
The responses about the emotional factors and encouragement were interesting. Most of the responses ranged from bad (37.50%) to moderate (25%). While this factor is one of the most important for designers to encourage them to brainstorm and find new ideas, it was once of the lowest ranked indicators about the designers’ satisfaction in their work. In relation to the designers’ tasks and company, a majority of the designers indicated that their role is understood at varying levels. 38.89% of the respondents indicated a moderate level of understanding and 38.89% indicated good understanding. Regarding the participation in decision-making processes, a majority of the responses indicated that their level of contribution to the design and decision-making process was either moderate (33.33%) or very good (33.33%).
Overall, the relations between designers and firms stand in a good position in terms of financial situation, working hours, flexible working hours, understanding the design role, and taking part of the decision-making process. On the other hand, designers are dissatisfied about the social security, health care, and emotional factors. A majority of the responses lay in the area between moderate and good with low numbers reporting full satisfaction. Therefore, the relation between companies and designers should be improved to reach a higher level of satisfaction among designers.
The Designers’ Activities Inside the Firm
The designers’ roles inside the companies were measured in the survey based on six factors; collaborate with the other departments, consider your opinion in taking decisions, contribute in building the company strategy, participate in every development stage, take roles in the UX or marketing research, and help managers to reshape the company structure. The collaboration between the design team and other departments inside the company is rated as high (33.33%) or very high (22.22%) by a majority of the respondents. This indicates that the design team is not isolated from the rest of the departments and there is good communication between them that ensure that the team has a clear understanding of the overall structure of the projects. Also, there is a high level of consideration for the design team’s opinion when it comes to decision making inside the company according to 52.94% of responses. This result aligns with the previous results about participating in decision making (33.33% reporting moderate and 33.33% reporting very good).
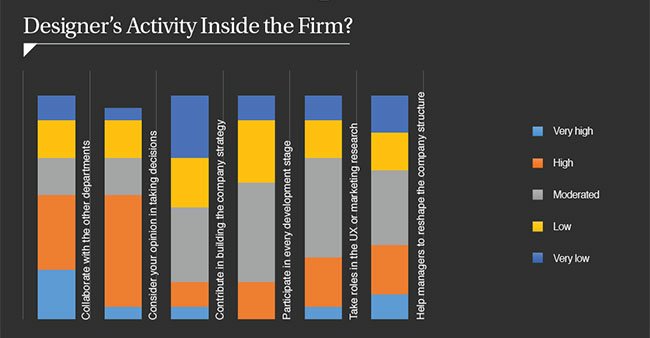
Regarding building the companies’ strategies, 33.33% responded that designers contributed moderately while 22.22% responded that designers contributed at a low level. This result may appear to conflict with the results of a previous question; “Where is Design Inside the Firm?” However, the contribution of design to the business strategy may take various forms, from the project-level to the holistic strategy of the organization. Another interesting result indicates that designers are having a moderate contribution level in participating in the development stages, UX or marketing research, and helping managers to reshape the company structure. As mentioned earlier, designers can contribute to a business’s success if they are allowed to take a more holistic role inside the organization.
What are the Creative Companies’ Priorities?
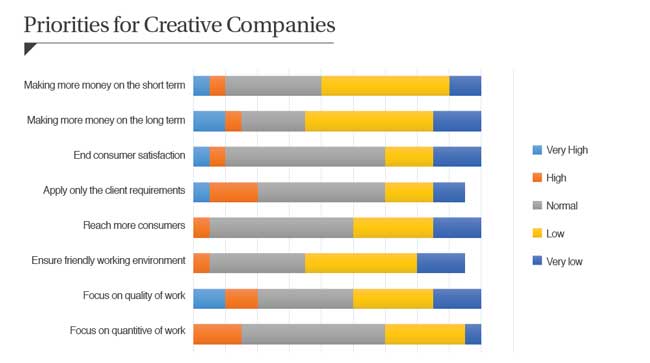
This question investigates how the relations between creative companies and (1) designers and (2) clients reflect on the companies’ priorities when forming a business strategy. 50% of the respondents indicated a normal level of priority for companies to achieve short-term profits. 33.33% reported that companies are putting long-term profits at a normal level of priority. There is a “Normal” level of priority for applying client requirements (50%), reaching more consumers (47.06%), and ensuring a friendly work environment (55.56%). On the other hand, there is a “High” priority for focusing on the quality (44.44%) and the quantity of work (44.44%). The results here indicate varied priorities for creative companies, which highlights a problematic absence of a clear consumer-driven strategy.
Overall, this survey provides an initial overview of the relation between designers and companies working in the creative sector, and about the nature of design within these companies. It can be used to evaluate how companies perceive design as a success factor in business. Overall, the responses indicate a moderate level of understanding the design role inside the organization. The survey indicates that designers are not underestimated inside the organizations. However, the relations between designers and companies should be improved to help companies to benefit from the holistic approach of design as a strategy within the company.
Download the Infographic
Click on the above link to download the infographic associated with this survey in high-quality PDF. In order to receive updates about our other design research results, make sure to join our newsletter.

